Think Like a Data Analyst: Find a Story in Real Data
Maps to: Data Analyst · Quantitative Analyst · Marketing Analyst · Journalist · Researcher · Management Consultant
Find the story in a table of numbers.
You leave with a chart that answers one question about a school's numbers. It shows you can find what numbers really say.
Ruben edits a small magazine, and he has a table of numbers from one school: grades, days missed and library visits, from before and after phones went into lockers. You pick the question, check the numbers an AI works out, decide what they really show, pick the chart, and write a short piece Ruben can run. The skill is the honest call: what the numbers show versus what you hoped they would, and never saying more than they prove.
How this shows up on a resume or college app
I worked through a school's numbers to answer question, checked the AI's maths myself, and wrote a short piece with a chart that argued finding, saying plainly what the numbers did and didn't support. I learned that the hard part of data analysis is asking the right question and not over-claiming the answer.
When you finish you have the thing itself, plus a Common App activity description Sidequest drafts from what you actually built.
Not sure yet? Play 5 minutes as a data analyst first and see how the work feels.
See what this career pays and what it takes to get in.
The plan
- 1
Step 1
Pick a question the numbers can answer
Ruben gives you a table from one school, from before and after phones went into lockers. Write the one question you want it to answer, plus one line on what answer would surprise you. Writing down what you expect BEFORE you see the answer is what keeps you honest at the end.
- 2
Step 2
Let the AI do the maths, then check every number
An AI works out the numbers from Ruben's table. Your job is the part that matters: checking its work, because these tools get numbers wrong while sounding completely sure, and one wrong number wrecks everything after it.
- 3
Step 3
Decide what the numbers really show, then pick the chart
The judgment step, and the reason this project exists: decide what the numbers actually show versus what you hoped to find, then pick the chart that shows it. Next to everything you claim, write one honest line about what it does NOT prove, so nobody reads too much into your chart. A smaller honest answer beats a big shaky one every time.
Go further
What counts: A short piece that says what you found in its first lines.
- 4
Step 4
Write it up for Ruben
Write a short piece that says what you found, with your chart in it. Ruben reads it and tells you the one thing he doesn't believe yet.
Tools you'll use
Real examples for inspiration

Classic Rock is Changing: 20 years of Q104.3 countdown data
Chris Dalla Riva
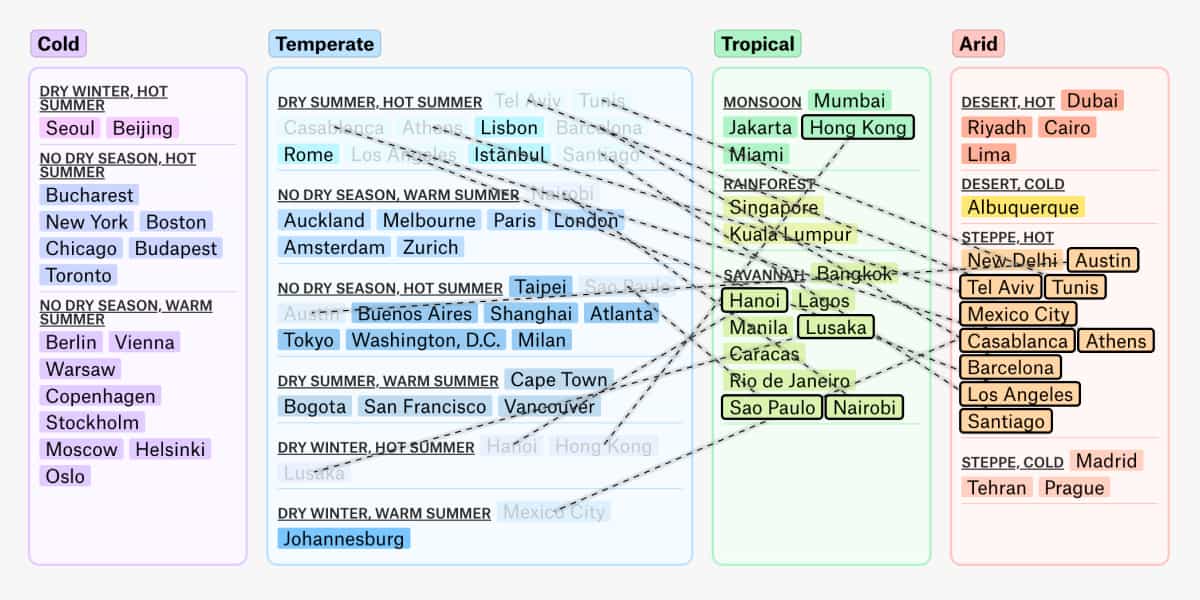
Climate Zones: how 70 cities will feel in 2070
Derek Taylor
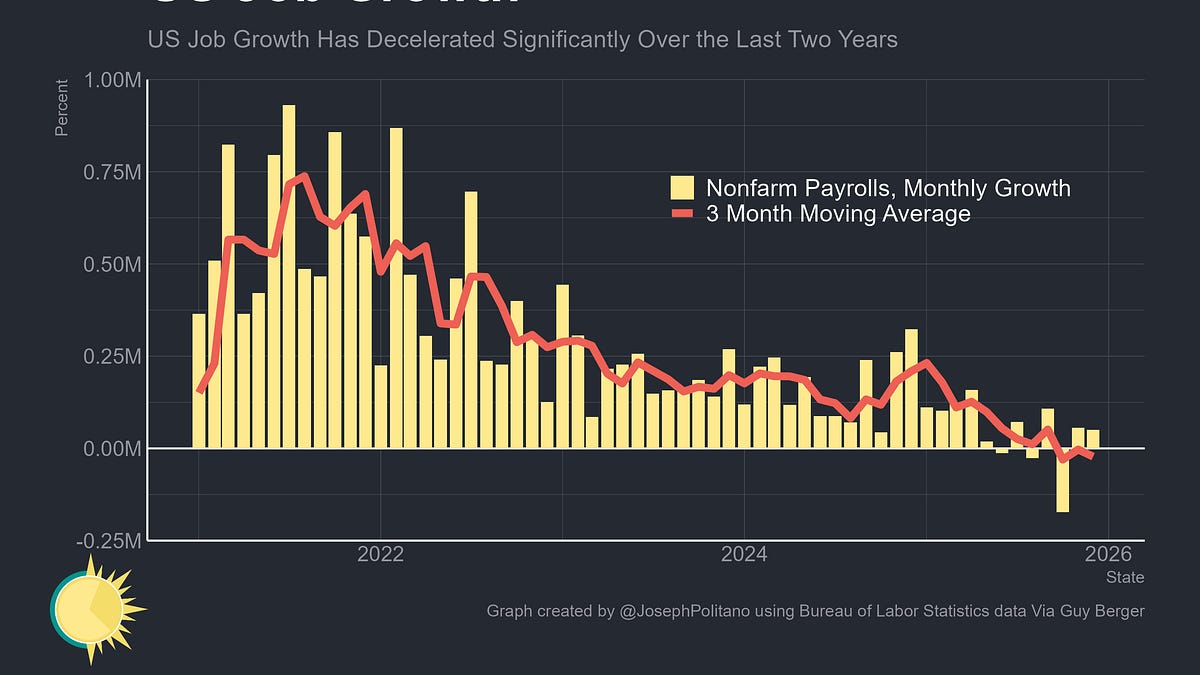
The 'No Hire' Economy: what a year of labor data says about who can't get hired
Joseph Politano

Games Are Too Long: counting why NBA games gained 90 seconds
Owen Phillips

The Four Types of Nones: k-means clustering 12,014 non-religious Americans
Ryan Burge